H2 Maths Formulas, Techniques & Graphs >> Functions and Graphs >> Functions >>
Inverse function: Rule, Domain, Rule & Graph
The inverse of a function exist only if the function is a 1-1 function.
Example
$$ g : x \mapsto x^2 - 2x - 2, \phantom{000} x \in \mathbb{R}, 1 \le x \le 4 $$
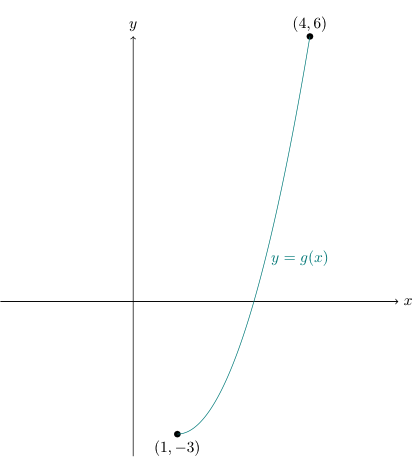
$g$ is a 1-1 function and $$ D_g = [1, 4], R_g = [-3, 6] $$
Domain & Range
The domain and range of $f$ and its inverse $f^{-1}$ are related by: $$ \boxed{ D_f = R_{f^{-1}} } $$ $$ \boxed{ R_f = D_{f^{-1}} } $$
Example
$$ g : x \mapsto x^2 - 2x - 2, \phantom{000} x \in \mathbb{R}, 1 \le x \le 4 $$
and $$ D_g = [1, 4] \text{ and } R_g = [-3, 6] $$
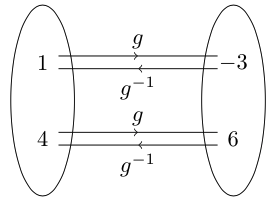
Since the inverse function ‘reverses’ the original function, $$ D_{g^{-1}} = R_g = [-3, 6] $$ $$ R_{g^{-1}} = D_g = [1, 4] $$
Rule of inverse function
Steps:
Let y equals to rule of function, i.e y = f(x)
Make x the subject of the equation (and if applicable, reject any inappropriate expression)
Form f⁻¹ by replacing y with x
Example
$$ g : x \mapsto x^2 - 2x - 2, \phantom{000} x \in \mathbb{R}, 1 \le x \le 4 $$
Step 1: Let y = g(x): $$ y = x^2 - 2x - 2 $$
Step 2: Make x the subject and reject the inappropriate expression given $D_g = [1 , 4]$ \begin{align} y + 2 & = x^2 - 2x \\ y + 2 & = \left(x - {2 \over 2}\right)^2 - \left(2 \over 2\right)^2 \\ y + 2 & = (x - 1)^2 - (1)^2 \\ y + 2 & = (x - 1)^2 - 1 \\ y + 3 & = (x - 1)^2 \\ \pm \sqrt{y + 3} & = x - 1 \\ 1 \pm \sqrt{y + 3} & = x \\ \\ \text{Since } & D_f = [1, 4], \\ x & = 1 + \sqrt{y + 3} \end{align}
Step 3: Form g-1 by replacing y with x $$ g^{-1} : x \mapsto 1 + \sqrt{x + 3}, \phantom{000} x \in \mathbb{R}, -3 \le x \le 6 $$
Graph of inverse function
The graph of a function and its inverse function are reflections about the line y = x.
Example
Given $$ g : x \mapsto x^2 - 2x - 2, \phantom{000} x \in \mathbb{R}, 1 \le x \le 4 $$
and $$ D_g = [1, 4] \text{ and } R_g = [-3, 6] $$

To obtain the graph of the inverse function by ‘DrawInv’ function in GC:

Graph the function

Back on main screen, enter the command as shown above
1. For ‘DrawInv’, press 2nd, prgm and select 8: DrawInv
2. To enter ‘Y1’, press alpha, trace and select Y1

Press enter to obtain the sketch
More on Functions:
Functions
Inverse function
Composite functions
Other concepts (on Functions)