Trigonometry: Sine graph
Sections:
1) Revision notes
2) Practice questions
Revision notes
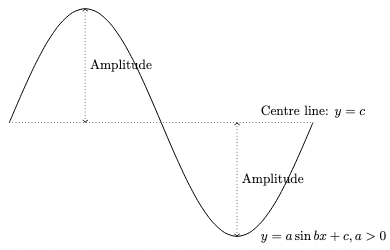
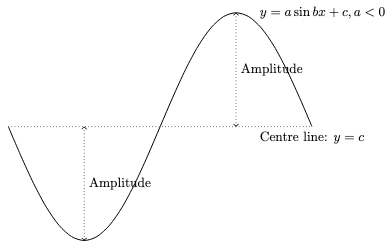
Shape and features of the graph y = a sin bx + c
Practice questions
Deduce the equation of a sine graph from a diagram
1. The diagram below shows the graph of $y = a \sin (bx) + c $.

Determine the values of $a$, $b$ and $c$.
(from A Maths 360 Workbook Ex 11.3)
Answer: $ a = 2, b = 2, c = 1 $

2. The diagram below shows the graph of $y = a \sin (bx) + c $.

Determine the values of $a$, $b$ and $c$.
(from A Maths 360 Workbook Ex 11.3)
Answer: $ a = -2, b = 2, c = 0 $

Deduce the equation of a sine graph from maximum and minimum values
3. The function $f(x) = a \sin x + b$, where $a$ is a non-zero integer, has a maximum value of $5$ and a minimum value of $-9$. Find the value(s) of $a$ and of $b$.
Answer: $ a = \pm 7, b = -2 $
(from think! A Maths Workbook Worksheet 9B)
Sketch a sine graph
4. Sketch the graph of $y = 2 \sin {\pi x \over 3} + 3 $, for $ 0 \le x \le 9 $.
Use a sine graph to deduce the number of solutions to an equation
5(i) On the same diagram, sketch the graph of $y = 3 \sin 2x$ and $y = 3 - {2x \over \pi}$ for $ 0 \le x \le 2 \pi $.
5(ii) Hence, state the number of solutions to the equation $ {2x \over 3\pi} = 1 - \sin 2x $ for $ 0 \le x \le 2\pi$.
Answer: $ 5 \text{ solutions} $
O Level past year questions on the sine graph
3. The function $f(x) = a \sin x + b$, where $a$ is a non-zero integer, has a maximum value of $5$ and a minimum value of $-9$. Find the value(s) of $a$ and of $b$.
Answer: $ a = \pm 7, b = -2 $
(from think! A Maths Workbook Worksheet 9B)

4. Sketch the graph of $y = 2 \sin {\pi x \over 3} + 3 $, for $ 0 \le x \le 9 $.

5(i) On the same diagram, sketch the graph of $y = 3 \sin 2x$ and $y = 3 - {2x \over \pi}$ for $ 0 \le x \le 2 \pi $.

5(ii) Hence, state the number of solutions to the equation $ {2x \over 3\pi} = 1 - \sin 2x $ for $ 0 \le x \le 2\pi$.
Answer: $ 5 \text{ solutions} $
Fully worked, step-by-step solutions to these past-year questions (2016 to 2025) are in the O Level A Maths Solutions page. For 2015 and earlier, selected questions and their solutions are available to subscribers, linked individually in the table below.
| Year & paper | Comments |
|---|---|
| 2023 P2 Question 7bi | Minimum value of graph |
| 2022 P1 Question 10 | Sketch graph |
| 2021 P1 Question 7 | Deduce equation from graph |
| Specimen P1 Question 2 | Sketch graph |
| 2019 P1 Question 12 | Sketch graph and deduce number of solutions to equation |
| 2017 P2 Question 10 | Sketch graph and deduce number of solutions to inequality |
| 2014 P2 Question 9 | Sketch graph and deduce solutions to equation |
| 2013 P2 Question 6 | Deduce equation from information and sketch graph |
| 2010 P2 Question 11i | Deduce coordinates of maximum point and minimum point from graph (Link 🔒 Subscribers) |
| 2009 P1 Question 9 | Sketch graph |
| 2006 P1 Question 2 | Deduce equation from graph |
| 2005 P2 Question 4 | Sketch graph |